
The Myth Busting Economist by Larry Malone
So Where Did All of the Inflation Come From?
Last time, we saw how our National Debt ballooned to $33 trillion from the $6 trillion spent by the Trump Administration and $3 trillion by the Biden Administration for the COVID rescue. The unprecedented spending definitely helped create an inflationary economy.
But inflation already had a foothold from Trump’s Tax Cut and Jobs Act which, starting in 2018, injected $2.3 trillion into an economy with a 4 percent unemployment rate. Economists take 4 percent as full (normal) employment, since there are always some people choosing part-time or seasonal work and others taking time away from the workforce. That’s why putting a large corporate tax cut into a thriving economy (something never done before in the United States) will create inflation.
The annual inflation rate consequently increased from 1.9 percent in 2018 to 2.3 percent in 2019, sending it above the Federal Reserve’s maximum target of 2.0 percent. The Fed responded by raising its Federal Funds rate FOUR times, taking the rate from 1.4 percent to 2.4 percent. Think of the Fed as “The Bank of the Banks,” with the Federal Funds rate representing the cost of borrowing for private banks. The rate goes up when the Fed seeks to slow down borrowing and spending.
The Fed was compensating for a warped government policy that injected a stimulus normally reserved for a recession into a roaring economy. The misdirected policy, as we saw last time, swelled our annual federal budget deficits and total National Debt. This brought another myth crashing down—that the Trump Administration had reduced our budget deficits and lowered the National Debt.
When COVID struck in March 2020, the economy was already overheating. Huge disruptions to both demand (consumption) and supply (production and distribution) created even more inflation.
Remember how we survived without many common household purchases during the onset of COVID? The exception was our most necessary necessity— toilet paper. Inflation can come from too little supply, too much demand, or a combination of both. In the case of toilet paper, the culprit was too much demand.
I remember Kai Ryssdal, the host of NPR’s “Marketplace Report,” pleading with listeners to not hoard toilet paper. Producers told Ryssdal they were making as many rolls as before the economy shutdown. But shelves were empty, and the price of a roll was more than a Big Mac. Why? Because everyone was stockpiling toilet paper.
The prices for many more items shot upward from excessive demand during the pandemic. With little to do, weekend warriors discovered that there’s a YouTube for every project. Home Depot, Lowe’s and local building suppliers had record years in 2021 and 2022. Plywood was $100.00 a sheet, an extraordinary increase that was attributable to normal levels of supply being outstripped by NEW demand.
After COVID’s first year, with vaccines in hand and a better understanding of how the virus spread, inflation intensified from what economists call “pent up demand.” Americans masked up to make up for lost spending time. Many went to Disney, learned to play golf, or added new subscription services to their monthly bills. And everyone pitched in with Amazon purchases that helped Jeff Bezos join Elon Musk in the 21st century space race.
Meanwhile, on the supply side of the economy, the best illustration of disruption came from the auto industry. A shortage of microchips from Asia meant few vehicles were rolling off assembly lines. Dealers marked up prices and used vehicle prices followed suit.
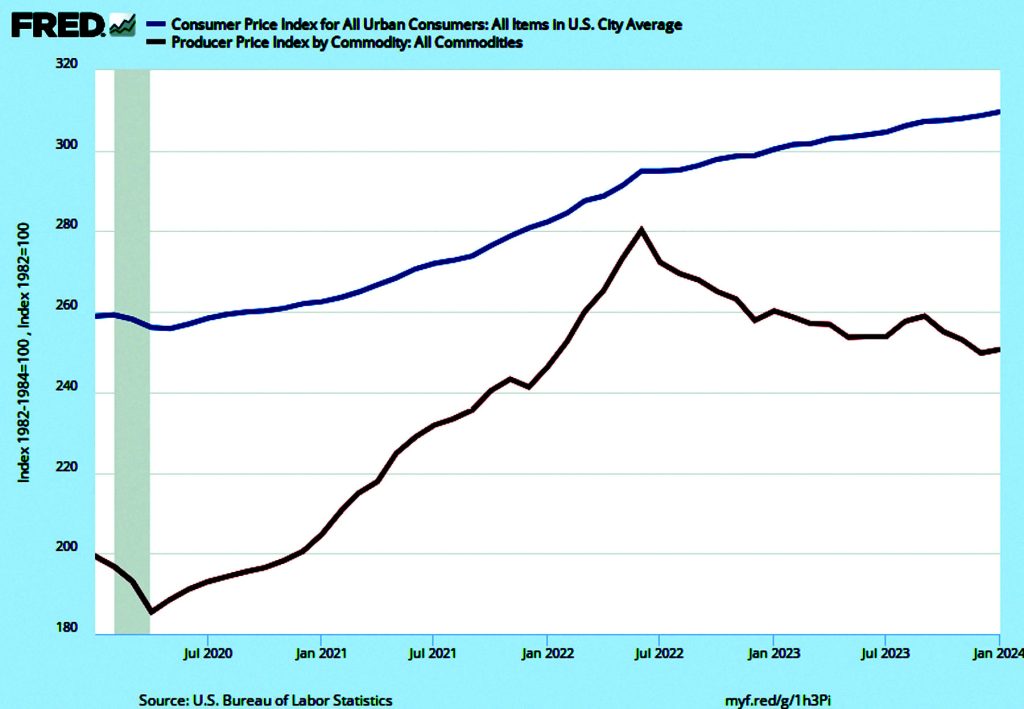
The two Demand and Supply sides of inflation over the past four years are depicted in the Federal Reserve chart (above). The top line is the Consumer Price Index—a monthly measure of the prices consumers pay for basic goods. Inflation has steadily increased on the demand (consumer spending) side of the market. The bottom line shows the Producer Price Index, the trend in prices producers pay for the things needed to make what they sell. Supply side (producer spending) inflation was more volatile, rising rapidly until June 2022 and falling since. The plunge means that there’s been deflation (falling prices) in the Producer Price Index for the past two years.
Taken together, the chart shows that consumers have continued to face rising prices for food and household items as costs have been falling for producers. That’s why the stock market has been booming on the heels of earnings reports showing record profits for corporations.
It seems we’ve busted another big myth making the rounds. Namely, that inflation is caused entirely by the president of the United States. COVID emergency spending played an early role, but inflation has since been driven by extraordinary changes in the marketplace.
Next time, we’ll follow up and drill deeper on all of the myths about the price of gasoline.
Larry Malone is professor emeritus of economics at Hartwick College.