
The Myth Busting Economist by Larry Malone
Understanding the National Debt
My last column highlighted recent trends in federal budget deficits and busted a couple of big myths about them. The first was that we haven’t always had deficits. We were running a surplus until 2002, when spending during the Bush Administration turned a $236 billion surplus in 2000 into a $-413 billion deficit in 2004 (a $-649 billion swing). The second was that deficits had recently been shrinking, as they should in a strong economy. But revenue reducing tax cuts that largely benefitted corporations by the Trump Administration took effect in 2018 and added $2.3 trillion to the National Debt.
We also unraveled how dysfunction in Congress has ended any semblance of a normal process in passing an annual budget. Instead, Continuing Resolutions have become the band-aids that keep our government running. Another Continuing Resolution was enacted just before the January 19 shutdown deadline, but it only keeps the government running until March 1.
Now we’ll have a look at how annual spending affects the National Debt, which is the total debt created by the federal government.
Our National Debt dates from the earliest days of the American Republic. When we fought the Revolution, we borrowed (from France) to pay for the weapons needed to take the fight to the British. When large parts of Margaretville and Prattsville were swept away by Hurricane Irene in August 2012, spending by FEMA was added to The Debt. The same was true over the last three years, when I-88 was repaved from Rotterdam to Oneonta. If you own savings bonds, CDs, or have some of your savings in Treasury funds, you own part of The Debt. And your bank or credit union uses some of the dollars you deposit with them to purchase U.S. Treasuries. They use your saved earnings to bolster their profit margins by owning some of The Debt.
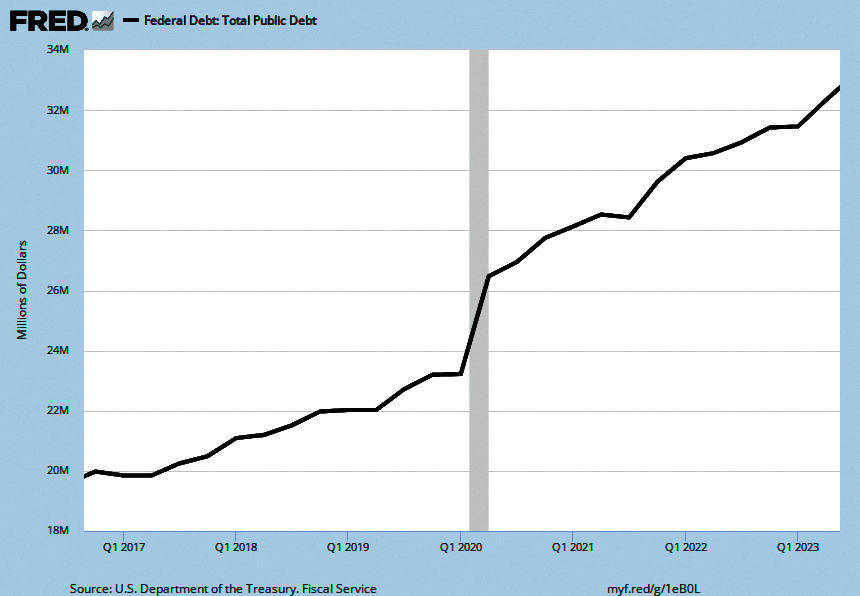
Let’s take a close look at the chart above that shows the growth of The Debt over the last six years.
The values on the left side of the chart are TRILLIONS of dollars. The HUGE spike in spending to address COVID in 2020 and 2021 is immediately apparent. The Debt went from $23.5 trillion before COVID to $28.5 trillion a year later. Is that bad?
One Debt myth would answer yes, seeking to alarm us by comparing it to selective types of household debt. “It’s like a credit card, and it would be irresponsible to have more credit card debt than your annual income.” But that misleading statement ignores what you might owe for a home and car—which could be three or four times more than what you earn each year. Currently, The Debt is only about 120 percent of the U.S. GDP (Gross Domestic Product, our measure of total income generated in the U.S. each year). That’s down from 133 percent of GDP in 2020, at the peak of COVID spending. So that means comparing The Debt to total household debt is a non-starter myth.
As the chart shows, The Debt does rise over time, as it has for most of American history. But as we get more distance from the economic challenges of COVID, it has once again been increasing at a more normal rate (while shrinking as a percentage of the GDP).
Now let’s finish up with a closer look at that big, unprecedented spike in federal spending which added more to The Debt during COVID. Remember those “stimulus checks” that kept us afloat and the Payroll Protection Program that helped businesses survive? Who was responsible for the spending that led to the surge in The Debt? The answer is in this table:
TRUMP (2016 to 2020)
December 2017 TCJA $ 2.3 trillion
March 2020 CARES Act $ 2.3 trillion
April 2020 CARES + $ .5 trillion
December 2020 CAA $ .9 trillion
TRUMP TOTAL $ 6.0 trillion
BIDEN (2020 to the present)
March 2021 ARPA $ 1.9 trillion
November 2021 IIJA $ 1.2 trillion
BIDEN TOTAL $ 3.1 trillion
TCJA (Tax Cut and Jobs Act)
CARES & CARES + (COVID Aid, Relief, & Economic Security)
CAA (Consolidated Appropriations Act)
ARPA (American Rescue Plan Act)
IIJA (Infrastructure Investment and Jobs Act)
The numbers bust a final myth about the roles of the two most recent presidential administrations in driving up The Debt. The Trump Administration added about $6 trillion to The Debt, while the Biden Administration added $3.1 trillion. Most of the emergency measures to address COVID were needed except, perhaps, a final round of stimulus checks included in the ARPA during the first months of the Biden Administration. And yes, the $9 trillion in federal spending had a role in the inflation that we’ve experienced for the past two years. That’s why inflation myth busting is on deck for next time.
Larry Malone is professor emeritus of economics at Hartwick College.