Advertisement. Advertise with us

(Graphic provided)
The Myth Busting Economist by Larry Malone

Spending, Deficit Kerfuffle Examined

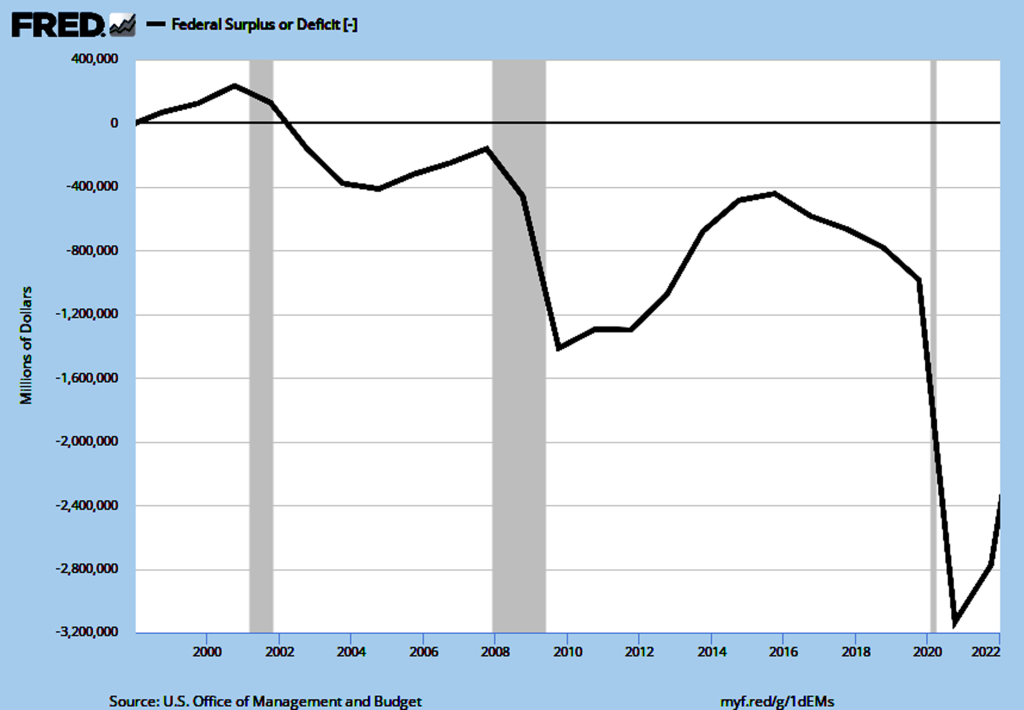
Some of us would like national health care, while others want to cut Social Security. We take up federal government spending in this column, but we’ll stay away from what it buys. Our myth busting will instead clarify the relationship between federal spending and budget deficits, and show where the deficits came from.

As I wrote these words, another federal government shutdown was looming. The January 19 deadline was part of a “kick the can down the road” deal in November to provide enough funds to keep the government running for another 65 days. That meant veterans would still receive benefits, people could visit the Grand Canyon and farmers would get their subsidies.

Until 2010, few of us paid much attention to the how and when of federal government funding. That was the last time the U.S. government followed a budget process that had worked pretty well for more than 200 years. The fiscal year ran from October 1 to September 30, with the President presenting a budget in January that was hashed out in negotiations and approved by Congress before September 30.

Small factions of our elected representatives have held the budget hostage to their pet funding (or defunding) priorities since 2010. For a few years, government shutdowns were avoided when the adversaries agreed to Continuing Resolutions before funding expired. As the first word implies, these deals continued to fund the government for a specific period of time.

But things got nasty in 2013 when a handful of senators, led by Ted Cruz, Marco Rubio, and Rand Paul, refused to pass a Continuing Resolution unless funding for the Affordable Care Act, aka “Obamacare,” was terminated. A shutdown ensued on October 1, in the midst of a fragile recovery from the financial collapse of 2008. It lasted 16 days, when the agitators gave up after the Dow dropped 6 percent and public opinion polls blamed them for sowing the seeds of a “double dip” recession.

Since then, we’ve seen two shutdowns: a short one of three days in January 2018 and a 35-day shutdown—the longest ever—from December 22, 2018 to January 25, 2019. The record-breaker was due to a difference of opinion over then-President Trump’s insistence on $5.7 billion to build a wall along parts of our border with Mexico. Trump eventually signed a Continuing Resolution after he discovered that declaring a national emergency would make executive funds available for the wall.

The latest shutdown threats come from quarters seeking to reduce the federal budget deficit, which is the annual amount by which expenditures exceed receipts (mostly taxes with some fees, fines and import duties). It might come as a surprise that we had budget surpluses as recently as 1998, 1999, 2000 and 2001. The chart provided from the Federal Reserve displays the switch in 2002 from federal budget surpluses to deficits.

The left side of the chart shows the budget deficit (or surplus) in millions of dollars. Along the bottom of the chart are years, from 1998 to the present. Surpluses are shown until 2001, when the solid trend line is above zero (a balanced budget). The -1,600,000 figure midway down (corresponding to the year 2010) translates into a -$1.6 trillion deficit. The shaded areas on the chart show when there is a recession. We’ve had three of those in the last 25 years: a nine-month recession before and after September 11, 2001; the so-called Great Recession from December 2007 to June 2009, and the short but severe COVID recession from February to May, 2020. Now let’s see what else the chart reveals.

First, budget deficits normally increase (worsen) during recessions (those shaded areas on the chart). That’s because receipts fall sharply when people out of work pay fewer taxes, businesses fail and government enacts tax cuts to assist with the hard times. Meanwhile, the government typically increases spending during recessions to help those in need. COVID “stimulus checks” kept folks afloat three years ago, while Payroll Protection Program payments to businesses helped them survive. Taken together, lower revenues and increased spending means the deficit grows during and immediately after recessions.

To boot, we’ve had the second (COVID) and third (Great Recession) worst downturns in the history of the country in the last 25 years (the Great Depression remains the worst). That’s why the deficit line plunges around 2008 and 2020 in the chart. But in the years afterward, the recovering economy restores revenues, and the temporary spending measures the government approves to soften the blow, end. The line begins to climb back toward zero as the budget deficit improves.

But there’s an exception in the chart, after the year 2017. The budget deficit worsens, and the line returns to its plunge. And this happens when the economy has recovered from the Great Recession and is growing at a healthy rate. The increase in the federal budget deficit is because of the Tax Cut and Jobs Act, passed in the first year of the Trump presidency. That act reduced revenue, and will ultimately add $2.3 trillion to our nation debt. The deficit worsens for the last three years of that administration, in a booming economy, even before we’re hit with COVID. We’ll learn more about that, and what it means for the national debt, next time.

Larry Malone is professor emeritus of economics at Hartwick College.

Posted

Leave a Reply

Your email address will not be published.

Related Articles